

Eventually, discipline research asks a question most don’t think to ask. Not if a habit is worth developing, and not how to develop a habit. This question is how long one can expect a deliberate effort to develop any given habit to take in order for the habit to develop enough to become almost automatic. The answer in popular culture is literature is almost always given with a vague, but a specific (and almost always the same), number of days. The number is a completely made-up number that has never resulted from habit formation research.
I. The 66-Day Study That Replaced a Myth
The “twenty-one-day” notion can be traced back to a 1960 book by plastic surgeon Maxwell Maltz, who noted that his patients took about three weeks to get used to a new face or missing limb and generalized that observation into a broader statement on how long any adjustment took. Over the years, this number was quoted in self-help literature without behavioral evidence to back it up so many times that it became one of those facts most people believe must have been proven by someone somewhere.

That, indeed, is worth a pause. What started as a measure of surgical patients’ psychological adjustment to a permanent change in their physical appearance has, over years of sloppy repetition, come to stand for how quickly an average daily behavior becomes automatic. The original observation never involved daily repetition or cue-based triggers, nor did it concern automaticity in the psychological sense in which contemporary researchers use the term. There is almost no connection between the two claims other than the three-week period and the general theme of change.
In 2010, Phillippa Lally and her colleagues from University College London published the first study to understand the real-world timeline for habit formation. Ninety-six volunteers, primarily postgraduate students, mean age of twenty-seven, selected an eating, drinking, or activity behavior to perform daily in a consistent context associated with a specific cue. Examples ranged from eating a piece of fruit at lunch to do fifty sit-ups after a coffee to going for a fifteen-minute run prior to dinner.
Lally and colleagues gave participants a lot of leeway in selecting their behavior, choosing it themselves rather than selecting it for them; this meant potentially less control over the results, but allowed for the study to examine habits people wanted to establish rather than imposing a researcher’s arbitrary habits. This decision is important for how the results will be received. An assigned behavior would likely lead to a cleaner result but probably have less to say about the process of self-initiated change a person has selected to pursue.
Participants logged onto a website each day for 84 days to report whether they performed the behavior as well as to report their self-perception of the automaticity level of that behavior. Items included: “I do it without thinking” and “I would find it relatively difficult not to do it.” Eighty-two participants out of the ninety-six were included in the study. Researchers traced the participant’s learning curve for each individual rather than combining them into one blended curve to best illustrate the level of automaticity.
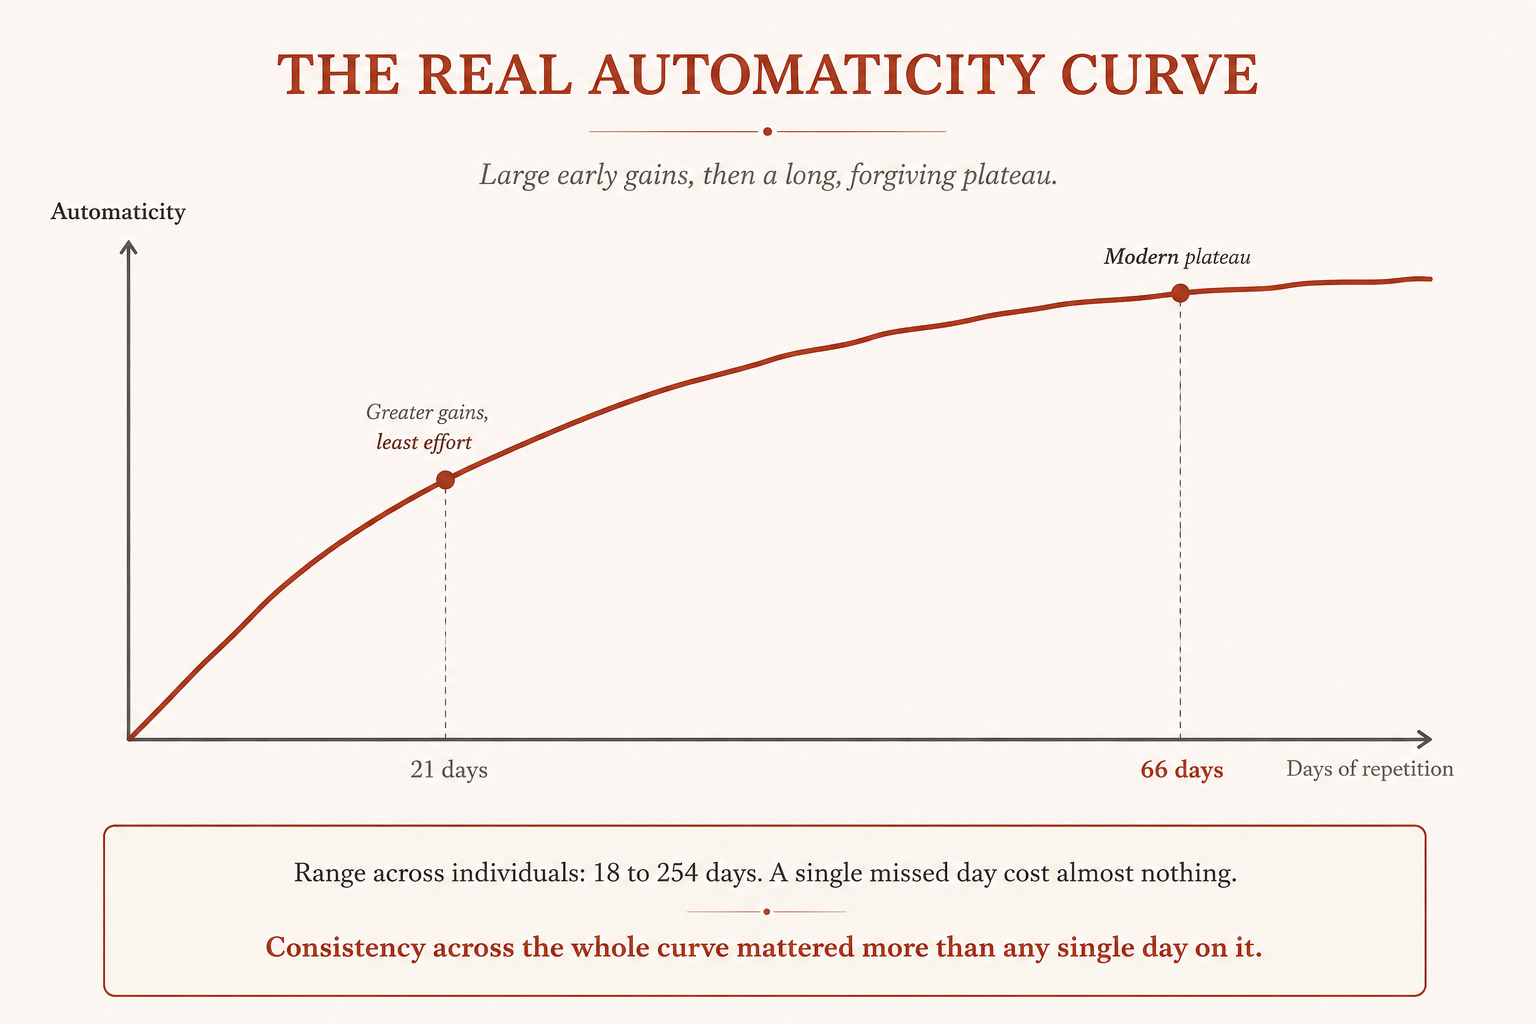
The modeled curves were quite similar for most of the participants, and the shape of the curve was close to an asymptote. The automaticity level increased rapidly for the initial repetitions, and then the amount of increase decreased with each repetition to the point that the curve leveled off. For each individual, the point of time when the curve of automaticity of the behavior reached 95% of the total level of automaticity (that is, the point of time that most closely approximates the formation of the behavior) was, on average, after 66 days. Within the 66-day period, the range was much longer. The behavior of some participants became automatic on the 18th day of the study, whereas other participants’ behavior approached automaticity after 254 days.
The twenty-one-day figure came from a surgeon’s observation about facial scars. The sixty-six-day figure came from watching automaticity actually form, one repetition at a time.
A real accounting of this study includes mentioning the true limitations rather than using the 66-day figure as a settled case. The measure of automaticity relied on the subjective reports of participants, a method which, as self-reporting, has the same errors in self-assessment. Among the 82 participants for whom we have usable data, the model only fit a good statistics pattern for 39 of them. This means that less than half of the sample showed the elegant pattern described in the main finding, while the others showed less systematic and unpredictable trends for which the model struggled to provide an accurate description.
II. Why Missing a Day Doesn’t Reset the Clock
The study has a discovery that is actually useful in practice. This is found outside the main finding of the study. Part of Lally’s study looked at lapses, an occasion missed when a participant was supposed to do the behavior. This is usually framed as a serious issue and is considered a reason to start over. If someone misses a single occasion, it actually has a tiny effect on the overall measure for automaticity and is small enough to really not matter. Additionally, automaticity continues to improve and doesn’t go to 0.
This matters because it directly contradicts the anxiety this issue creates in people. People think of this issue as resetting the entire process when it is believed that a single missed day means the entire process is reset, because of the framing of the 21-day issue. Lally’s data actually shows that this process has more depth and is actually closer to a gradual process where there is more tolerance of overlap than it is to a fragile process that has to be done with absolute certainty, like a streak.
A broken streak has psychological effects on the attempt and the person. Most people treat broken streaks as evidence that the entire effort is worthless and can be abandoned. However, broken streaks do not have such a large impact on the underlying data the way most people think. The curve is much more forgiving of missed attempts than most people are of themselves. The curve cares about the overall trend. The overall trend is more likely to be intact after most missed attempts.
The study also reported that participants who performed their behavior consistently over time could fit the smooth asymptotic model significantly better than participants with more variable performance, even better than the single missed day case. Lapses did not ruin the trajectory. The opposite was true for participants with high levels of variable, irregular performance. Participants in this category produced a messy curve that the researchers had a lot of trouble modelling, if at all. Overall, most participants believed consistency over the entire 84 days was more important than a single missed attempt.
When brought together, the two findings show a clear and notable picture rather than a paradox. One missed Tuesday has almost no value. A pattern of missing each approximately every third day, scattered inconceivably throughout the record period, generated a notable difference and a less trustworthy trajectory. The difference has nothing to do with perfection versus imperfection. One of them is an isolated gap in a person’s consistent and predictable behavior. The other is a totally inconsistent pattern with no reliable and constant behavior.
III. The One Technique That Actually Moves the Needle
Understanding habits is a completely different research field. Understanding the habits is helpful for knowing the actions one could take to assist the process. The research is interested in which behavior change techniques affect the outcome more.
Before we look into the research, we need to make a note of the gap in scale between this research and the original habit timeline research. Lally’s research team studied 96 participants over 84 days. The research on the techniques that assist is grounded on a combined sample over many hundreds of thousands of participants, across many years of independently conducted interventions, and is concerned with which techniques assist in the outcome, and not how the automaticity of one individual is formed.
In 2009, Susan Michie and others conducted a meta-regression analysis of 122 physical activity and eating interventions, which when combined amounted to 44,747 participants. They coded the interventions using a reliable theory and tested behavior change techniques and assessed which of those predicted the size of the resulting effect. The interventions combined to a pooled effect size of 0.31, with a 95 percent confidence interval of 0.26 to 0.36.
What is the timeline for habit formation? Well, not much can be said about the other ways a person might support the process other than that there is a lot of research on this. This research examines which behavior change techniques, tested through real-world interventions, have been shown to successfully impact change in the realm of human behavior.
The difference in size between this second body of research and the original habit timeline is worth mentioning before getting into the findings. Lally’s team studied 96 people over 84 days. The research that addresses what actually helps draw on a combined sample many, many, many, many times more than that, spanning a period of over 10 years of independently conducted interventions. Ultimately, it allows the research to answer a unique type of question, one that is much larger and more generalized than how the habit formation process plays out in the eyes of a single individual.
In 2009, Susan Michie and some colleagues, Charles Abraham, Craig Whittington, John McAteer, and Sunjai Gupta performed a meta regression that included 122 physical activity and healthy eating intervention evaluations, which together included 44,747 participants. Using the consistent description of 26 behavior change techniques, this team provided a coding for what each intervention involved, and then adjusted which behavior change techniques they included to predict outcome. The overall effect of the interventions was rated to have the average size of 0.31, with a 95 percent confidence interval of 0.26 to 0.36.
One technique explained more of the difference between effective and ineffective interventions than any other tested. It was simply tracking the behavior.
One technique stood out among the other 25. The self-monitoring method, which involves recording whether the target behavior occurred, explained the most variance (13 percent, in isolation) when the 122 evaluations were compared. Interventions that incorporated self-monitoring along with at least one other technique from control theory, for example, assessing behavioral goals or receiving performance feedback, had a considerably larger average effect (0.42) compared to the effects (0.26) of other interventions that did not include self-monitoring.
Given the size of this research endeavor, the difference, 0.42 and 0.26, represents a real-world difference. An effect of this size, when observed across many studies that were conducted separately, compared to an effect observed in a single study, is harder to dismiss and most likely comprises a real-world phenomenon.
The reason for this phenomenon is fairly obvious. Someone cannot adjust a behavior if they are not monitoring that behavior, and Lally’s asymptotic curve assumes there are repeated observations, so that behavior stabilizes. Self-monitoring provides the feedback loop, making a person’s behavior known to themselves, and closing the intent to behavior gap that quickly expands when behavior is no longer monitored.
This directly relates to some findings I provided in my first part of the research on timelines. Lally’s curve describes what happens when you consider the consistency of repetition. Michie’s meta-regression discovers the actual technique that consistency shows up for in the real world outside of the lab. The two findings do not just belong next to each other. One explains the shape, and the other explains the most important factor for reaching that shape.
IV. Turning the Timeline Into a Plan
Lally and Benjamin Gardner published additional work later to make more sense of their original 2010 research findings. Their recommendations gave the typical observer a course of action to apply instead of just observing. Of the recommendations, there are two that are clearly based on real data as opposed to others that were probably derived from the data with a little more intuition.
The first of the suggestions is tied to simplicity in the behavior itself. In the original study, it was noted that simpler behaviors, e.g. drinking a glass of water after a specifically chosen meal, met study participants’ goals of reaching the state of psychic automation (or automaticity) faster and with a smoother curve. Adding complexity to a behavior introduces decision-making steps and day-to-day interruptions that interrupt the behavior and add noise to the process that the asymptotic model is learning.
This recommendation goes against what many of us do, which is to adopt the most difficult (or ambitious) iteration of the new habit, saving the easier adaptations of the habit for later. The goal of the original study participants was to achieve the same goal of behavioral automation, but with a series of small, repetitive behaviors (and keeping the overall goal less ambitious).
The second recommendation is context stability over willpower. The behavior study linked each behavior to a specific, consistent cue, because a consistent context allows a particular behavior to become automatic. Consistent behavior at different times or in different locations, depending upon different triggers each day, would never become associated with a consistent cue, and is one reason researchers deal with context stability as a requirement for automaticity as opposed to an enhancement.
The distinction between a willpower approach and a context approach is worth describing because they yield very different daily experiences. A willpower approach requires a person to think each day about whether now is the proper time to perform the behavior. A context approach reduces the burden each day by using an inflexible daily trigger. The second approach uses far less of an individual’s daily motivation. This may explain why, in Lally’s original data, consistent context yielded a cleaner automaticity curve.
V. Building a Realistic Habit System
These three lines of research describe a much more specific and more forgiving process than the 21-day story has ever described. Habit formation has a measurable timeline that, according to Lally and her colleagues, is on average much longer than most people think, with much more tolerance for lapses. According to Michie and her colleagues, the most consistently effective single ingredient from a large and diverse body of intervention research is to explicitly track the behavior. Putting these findings into practice means choosing a simple behavior associated with a fixed and stable cue, as recommended by Lally and Gardner in their more applied recommendations, over a goal behavior that is scattered across different and unpredictable contexts.
A system built upon this evidence would operate on a smaller scale and require less drama than most habit advice does. Start with a single, easy-to-accomplish goal that can be done in under two minutes on your toughest of days. This should be a goal that is smaller in scope than where you ideally want to be in your goal setting, but something you can do on a terrible morning. Attach your goal to a cue that is already a part of your routine, usually a specific point in a routine that remains the same regardless of what your day or your mood might be. Track your completion of this goal after the day is done, using either pen and paper or an app to help. Expect that the habit will take much longer than Lally’s study sites, likely closer to two or more months rather than a few weeks.
None of these guarantees that you will get a specific date when a certain habit will magically be easy to do. From the data that Lally reports, there is a lot of individual variation, meaning that a specific promised date would be misleading. The research provides a goal and a specific, evidence-based tool that is within your control and that you can do regardless of how long your habit takes to build.
The One Thing to Do Today
Pick one small behavior that takes less than two minutes to perform. Attach this behavior to a cue that you do every day regularly. Once you’ve done that, create a system to check it off. Note: app of your choice. Begin this today, since you can expect this to take around two months to see benefits from rather than three weeks.
Have advice, a letter, or a suggestion for us? Send it to kanpoteau@gmail.com.
This piece is part of an ongoing series on how discipline and behavior change actually work, drawn from the same research, including the parts that complicate the popular version of the story, that shapes everything published here at Deliberate Project.
See you next time,
The Deliberate Project Team
References
1. Lally, Phillippa, Cornelia H. M. van Jaarsveld, Henry W. W. Potts, and Jane Wardle. “How Are Habits Formed: Modelling Habit Formation in the Real World.” European Journal of Social Psychology, 2010.
2. Michie, Susan, Charles Abraham, Craig Whittington, John McAteer, and Sunjai Gupta. “Effective Techniques in Healthy Eating and Physical Activity Interventions: A Meta Regression.” Health Psychology, 2009.
3. Lally, Phillippa, and Benjamin Gardner. “Promoting Habit Formation.” Health Psychology Review, 2013.
If this is a pattern you have lived through yourself, say so below. The comment that describes it best usually helps the next reader more than anything I could add.